Environmental Compliance Documentation
Bio-Medical Waste Annual Report
Complete waste handling metrics, disposal data and environmental impact assessment across Assam's healthcare network.
0
Total HCFs
0
Beds covered
0
Tonnes / year
4
Districts
CBWTF Operations — Guwahati

Treatment Plant
BMW Fleet
Scroll to explore
🏥
542
Healthcare Facilities
🛏
9,287
Hospital Beds
🏢
107
Beded HCFs
🏬
435
Non-Beded HCFs
⚖
934.9 T
Annual Waste
🗺
77,913
kg / Month
Waste Composition
Annual Waste by Category
All four districts combined — based on 12-month average data for 2025.
🟡
400,141 kg
per year
Yellow Waste
42.8%
of total
🔴
383,087 kg
per year
Red Waste
41.0%
of total
🔵
131,440 kg
per year
Blue Waste
14.1%
of total
⚪
20,284 kg
per year
White Waste
2.2%
of total
Waste Category Mix
Annual share by type (2025)
Yellow 42.8%
Red 41.0%
Blue 14.1%
White 2.2%
Monthly Average by Category
All districts combined (kg/month)
Yellow
Red
Blue
White
District Analysis
Waste by District
Annual totals and HCF counts across all four service areas.
01
Primary Zone
Kamrup Metro
778,128 kg/yr
83.2% of total volume
Total HCFs457
Hospital beds7,408
Monthly avg64,844 kg
02
Rural North
Kamrup Rural
126,864 kg/yr
13.6% of total volume
Total HCFs35
Hospital beds1,063
Monthly avg10,572 kg
03
Extended Zone
Nalbari
21,691 kg/yr
2.3% of total volume
Total HCFs21
Hospital beds565
Monthly avg1,808 kg
04
South Bank
KR South Bank
8,269 kg/yr
0.9% of total volume
Total HCFs29
Hospital beds251
Monthly avg689 kg
Annual volume by district
Total kg/year, 2025
Waste type per district
Stacked monthly average (kg/month)
Yellow
Red
Blue
White
Summary Data
District Summary Table
Monthly Average Waste Generation — All Districts, 2025
Average based on 12 months of data. Figures in kg/month.
| District | Beded | Non-Beded | Total HCF | Beds | 🟡 Yellow | 🔴 Red | 🔵 Blue | ⚪ White | Total kg/mo |
|---|---|---|---|---|---|---|---|---|---|
| Kamrup Metro | 76 | 381 | 457 | 7,408 | 28,515 | 25,769 | 9,364 | 1,196 | 64,844 |
| Kamrup Rural | 14 | 21 | 35 | 1,063 | 3,977 | 5,084 | 1,163 | 348 | 10,572 |
| Nalbari | 10 | 11 | 21 | 565 | 535 | 769 | 372 | 132 | 1,808 |
| KR South Bank | 7 | 22 | 29 | 251 | 317 | 302 | 55 | 15 | 689 |
| Grand Total | 107 | 435 | 542 | 9,287 | 33,345 | 31,924 | 10,953 | 1,690 | 77,913 |
Annual Report — 2024
The complete 2024 bio-medical waste management report covering all service districts, including HCF lists, waste statistics, and full compliance documentation.
View 2024 Annual Report →Our Facilities & Fleet
State-of-the-art CBWTF and certified bio-hazard collection operations across Assam

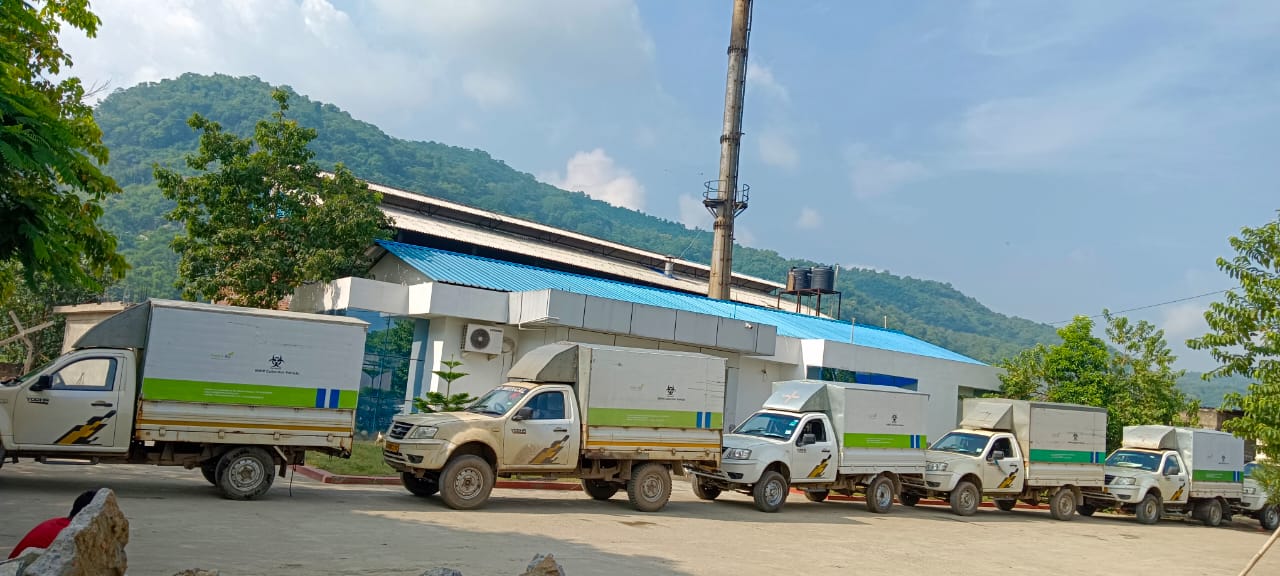
BMW Collection Operations
PPE-equipped team — certified bio-hazard waste pickup
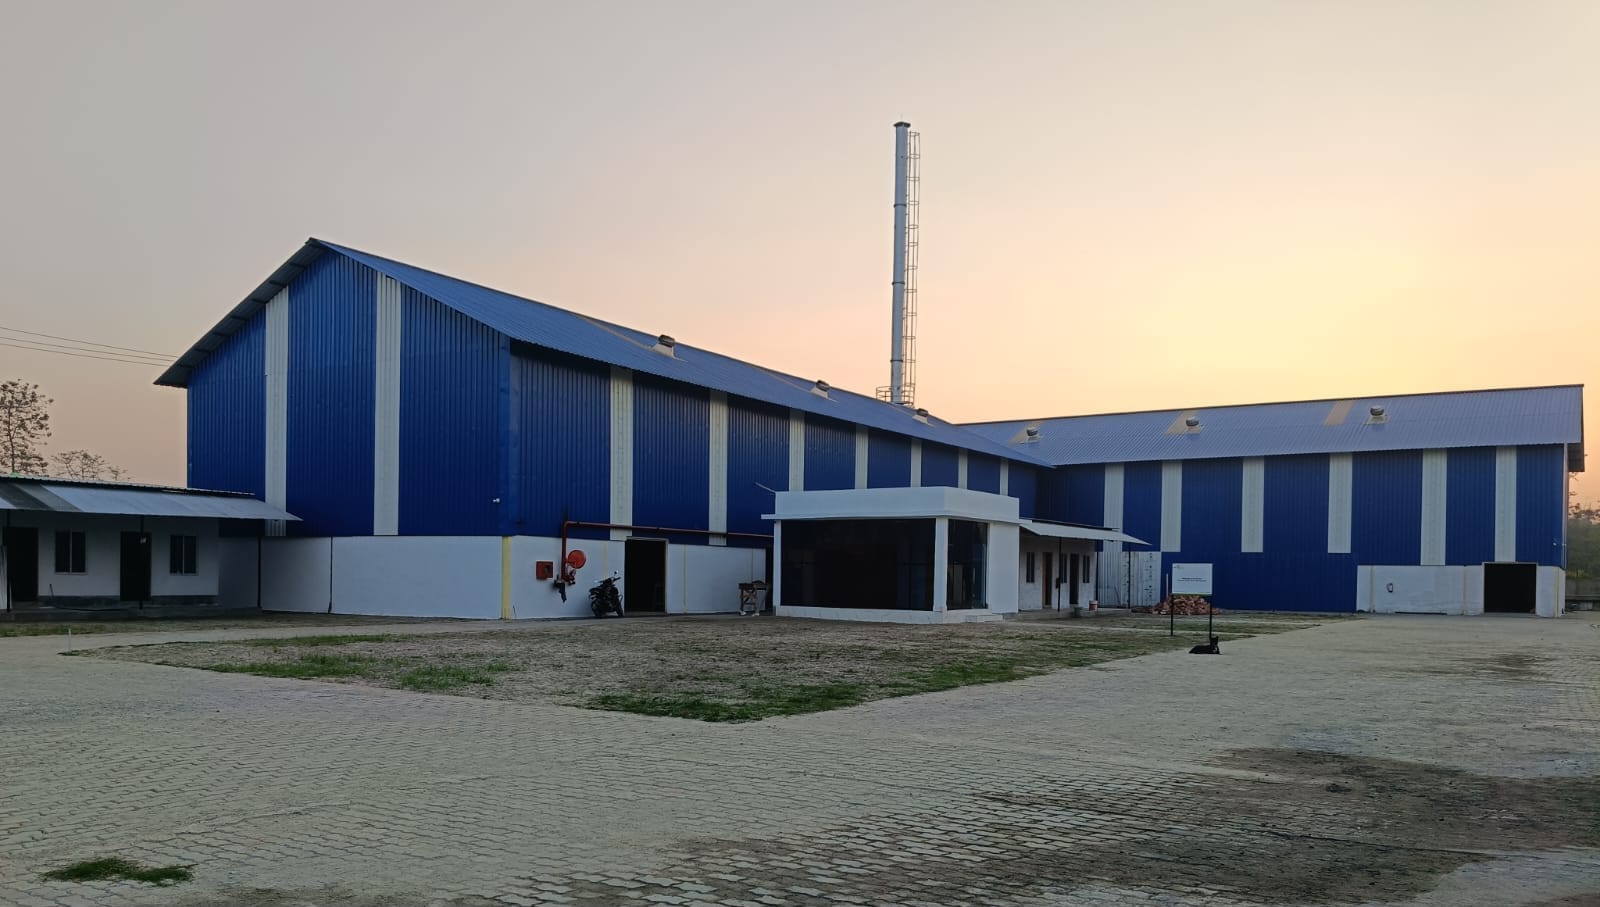
CBWTF Plant — Guwahati
Full treatment and incineration facility

Environmental Compliance
Committed to safe waste management